


EnCor Biotechnology
Mouse Monoclonal Antibody to c-FOS (cFos, Fos, AP-1), Cat# MCA-2H2
Description
The MCA-2H2 antibody was made against recombinant full length human c-FOS expressed in and purified from E. coli. It can be used to identify activated cells in cell culture and in sections and to follow c-FOS expression in western blots of cell and tissue homogenates. The antibody also works well on formalin fixed paraffin embedded sections, select the "Additional Data" for this data. The KD is 6.68 x 10⁻¹⁰ M, Kon rate is 1.36 x 10⁵ 1/MS and the Kdis rate is 9.12 x 10⁻⁵ 1/S, all indicative of unusually high affinity. The same recombinant immunogen was used to generate a rabbit polyclonal antibody to c-FOS, RPCA-c-FOS, and MCA-1B62 which have similar properties. The MCA-1B62 was screened for high sensitivity on floating section ICC and on formalin fixed paraffin embedded section for IHC.
- Cell Type Marker
- Immunohistochemistry Verified
- Mouse Monoclonal Antibodies
- Our Most Widely Used Reagents
- Pathology Related Marker
Add a short description for this tabbed section
| Immunogen: | Full length recombinant human protein expressed in and purified from E. coli. |
| HGNC Name: | FOS |
| UniProt: | P01100 |
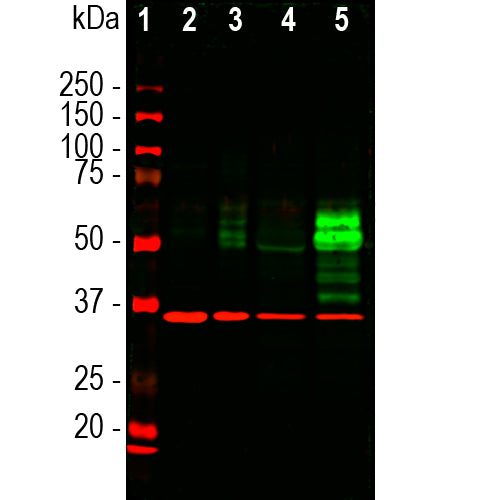
| Molecular Weight: | 50-65kDa |
| Host: | Mouse |
| Isotype: | IgG1 heavy, κ light |
| Species Cross-Reactivity: | Human, rat, mouse |
| RRID: | AB_2571561 |
| Format: | Protein G affinity purified antibody at 1mg/mL in 50% PBS, 50% glycerol plus 5mM NaN3 |
| Applications: | WB, IF/ICC, IHC |
| Recommended Dilutions: | WB: 1:500, IF/ICC: 1:200, IHC: 1:1,000-1:2,000 |
| Storage: | Store at 4°C for short term, for longer term store at -20°C. Stable for 12 months from date of receipt. |
The FOS gene and protein were originally identified as the transforming element in a viral oncogene. The transforming protein was named v-FOS, for viral FOS, and the normal cellular non-transforming proto-oncogene was called c-FOS, for cellular FOS. The c-Fos protein is also known as cFOS, AP-1, C-p55, Fos proto-oncogene and AP-1 transcription factor subunit. FOS is an acronym for "FBJ murine osteogenic sarcoma", the virus in which the gene product was first discovered. The c-FOS protein is a normal gene acting as an on/off switch controlling the expression of many other genes. The v-FOS form is mutated to stay in the on position, this persistently activating other genes and promoting unregulated cell division. The unmutated c-FOS is an "immediate-early" gene, so-called because protein expression is usually very low but increases rapidly and transiently in response to a wide array of stimuli including serum, growth factors, tumor promoters, cytokines, and UV radiation. Newly expressed c-FOS protein associates with JUN family and other basic leucine-zipper (bZIP) proteins to create a variety of activator protein-1 (AP-1) complexes (1). AP-1 complexes specifically activate the expression of many other genes and so regulate cellular responses to stimuli which may result in cell proliferation, differentiation, neoplastic transformation, apoptosis, and response to stress (2). The regulated expression of c-FOS therefore plays an important role in many cellular functions. Site specific phosphorylation activates c-FOS, while sumoylation of c-FOS inhibits the AP-1 transcriptional activity (3,4). Since c-FOS expression is induced in neurons which are rapidly firing action potentials, appropriate c-Fos antibodies can be used to identify activated neurons in tissues for tracing neuronal projections and other purposes (5). Using current techniques it is possible to identify such activated cells using c-FOS staining then obtain further data on their specific protein and mRNA expression.
Our cFOS antibody has become widely used as sold by EnCor and through our numerous OEM partners, and information can be viewed using Google scholar by searching for "MCA-2H2” or by selecting here. Here is a CiteAb link to peer reviewed publications which use this antibody obtained directly from EnCor, here.

Chromogenic immunohistochemistry of formalin fixed paraffin embedded rat brain. Rat hippocampus was stained with mouse mAb to cFos, MCA-2H2, dilution 1:1,000, detected in DAB (brown) using the Vector Labs ImmPRESS method and reagents with citra buffer retrieval. Hematoxylin (blue) was used as the counterstain. MCA-2H2 specifically detects the nuclei of spontaneously active or experimentally stimulated neurons. Mouse click on the image to get an enlarged view.

Chromogenic Immunohistochemistry of Formalin Fixed Paraffin Embedded Mouse Material. Mouse hippocampus was stained with mouse mAb to cFos, MCA-2H2, dilution 1:1,000, detected in DAB (brown) following the Vector Labs Vector Labs mouse on mouse (MOM) method, using the kit instructions and citrate retrieval. Hematoxylin (blue) was used as the counterstain. MCA-2H2 specifically detects the nuclei of a few spontaneously active neurons. Mouse click on the image to get an enlarged view.
As part of the characterization of this antibody we grew HeLa cells and mixed neuronal-glial cultures and compared stimulated and unstimulated cells. Cultures were processed using our standard fixation and staining procedure (protocol here).

Immunofluorescent analysis of HeLa cells stained with mouse mAb to cFos, MCA-2H2, dilution 1:1,000, in green, and co-stained with chicken pAb to Vimentin, CPCA-Vim, dilution 1:2,000 in red. The blue is DAPI staining of nuclear DNA. HeLa cells were maintained in fetal bovine serum (FBS) free media for 24 hours, Control (image above) or 20% FBS was added for 2 hours to stimulate cFos expression (image below). Mouse select each image for a larger view.

A similar experiment was performed with mixed E20 rat cortical derived neuron-glial cultures.

Immunofluorescent analysis of rat cortical neuron-glial cell culture from E20 rat embryos stained with mouse mAb to cFos, MCA-2H2, dilution 1:1,000 in green, and costained with rabbit pAb to GFAP, RPCA-GFAP, dilution 1:5,000 in red. Cells were cultured under normal conditions, Control (image above) or cells were induced by incubating in membrane deplorization buffer, a salt solution containing 170mM potassium, for 5 hours (image below). MCA-2H2 antibody detects cFos protein only in stimulated neurons, while glial cells do not respond to this activation. The blue is DAPI staining of nuclear DNA. Mouse select each image for a larger view.

Kinetic data; we used the data shown below to derive a dissociation equilibrium constant (KD values) for this mouse monoclonal antibody. The KD is simply the ratio of the dissociation rate (koff) to the association rate (kon). Thus, KD and affinity are inversely related so that the lower the KD value, the higher the affinity of the antibody for its target. The figure below summarizes binding data for EnCor's mouse monoclonal antibody to recombinant human c-FOS protein (MCA-2H2). MCA-2H2 displayed very strong affinity for c-FOS (KD = 0.7nM).

Above, binding curve set for MCA-2H2 (25nM IgG) and limiting dilutions of recombinant c-FOS protein (0-350nM) obtained using our in-house label-free bio-layer interferometry system (Octet RED96). Color-coded traces show sensorgram data normalized to baseline after subtraction of 0nM IgG signal from all channels. Traces with overlying fit lines in red indicate their inclusion in the global fit analysis used to derive kinetic parameters listed under the legend (R^2 - goodness of correlation between the fit and data; kon - association rate constant; koff - dissociation rate constant; KD = koff/kon - affinity constant/equilibrium dissociation constant; see EnCor’s validation pipeline for more details). Mouse click on the image to get an enlarged view.
1. Mildle-Langosch K. The Fos family of transcription factors and their role in tumourigenesis. Eur. J. Cancer 41:2449-2461 (2005).
2. Chiu R, et al. The c-Fos protein interacts with c-Jun/AP-1 to stimulate transcription of AP-1 responsive genes. Cell 54:541–52 (1988).
3. Karin M. The regulation of AP-1 activity by mitogen activated protein kinases. J Biol Chem. 270:16483-6 (1995).
4. Bossis G, et al. Down-regulation of c-Fos/c-Jun AP-1 dimer activity by sumoylation. Mol Cell Biol.25(16):6964-79 (2005).
5. Dragunow M, Faull R. The use of c-fos as a metabolic marker in neuronal pathway tracing. J. Neurosci. Mets. 29:261–265 (1989).
Add a short description for this tabbed section


,%20Cat%23%20MCA-2H2)